I was looking for a lab that would give me hands-on practice of real Tier 1 SOC workflows: understanding logs, building detection queries, and analyzing suspicious behavior. So I was able to simulate a mini SOC environment using Splunk and a synthetic dataset of Windows logon events created by Chatgpt.
Here is an overview of my Lab Setup:
| Component | Details |
| SIEM Platform | Splunk Enterprise (Free Tier) |
| Log Source | Synthetic Windows Logon Events (CSV) |
| Key Event Codes | 4624 (Success) 4625 (Fail) |
| Tools Used | Splunk Search & Reporting App |
| Time Range | Full day of simulated Activity |
Lab Setup:
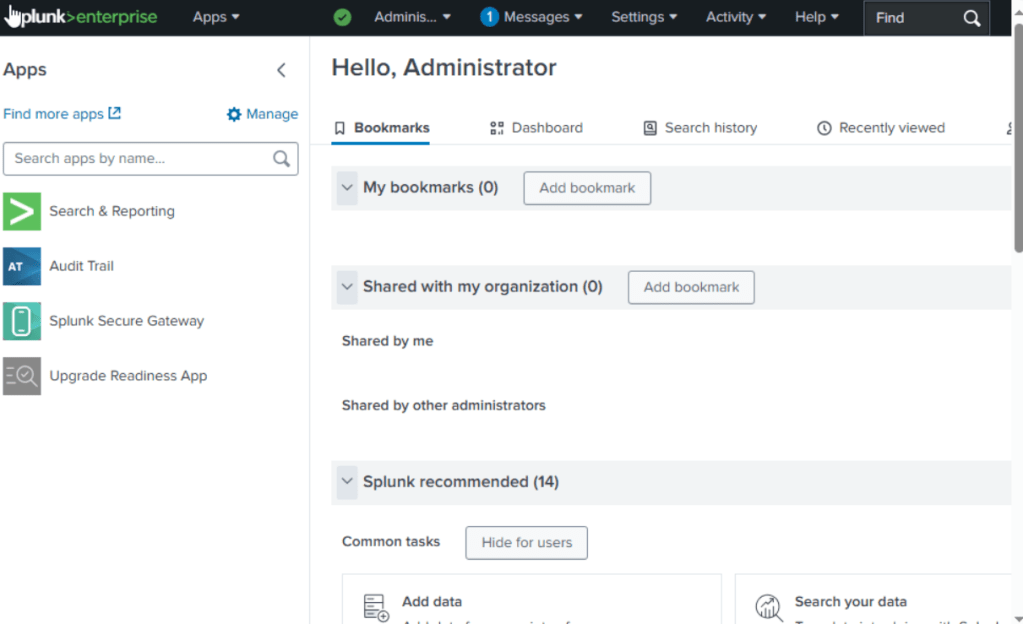
1. I created a new Windows 10 VM using VirtualBox and downloaded Splunk Enterprise from splunk.com. Then I installed Splunk directly into the VM and used the Access Web UI.
Splunk uses default port 8000 so i was able to Access Web UI at http://localhost:8000
2. I then had chatgpt create me a synthetic log file (synthetic_brute_force.log) to simulate a brute force attack. The log file contained:
- 20 failed login attempts (4625) for user jdoe from a suspicious IP
- 1 successful login (4624) for user admin
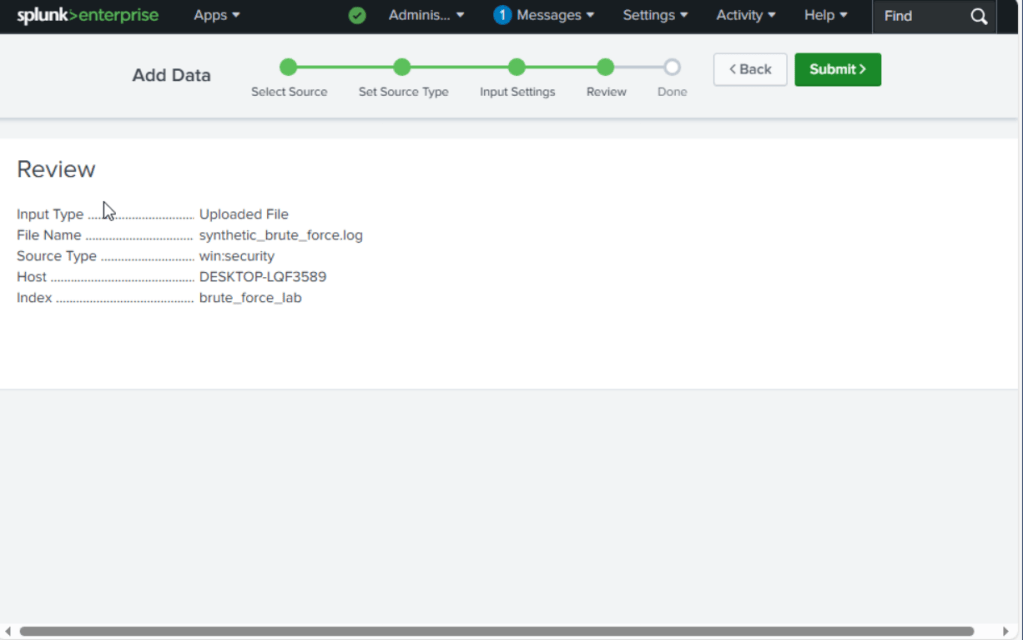
3. I uploaded the log file into Splunk and assigned it to a custom index (brute_force_lab)
4. Used Search & Reporting to analyze and created a dashboard to visualize login behavior

Here are the Key Search Queries Used:
1. Failed and Successful Login Count Over Time
In my first panel, I wanted to display how many failed and successful login events happened every 30 seconds over the log time span.

Let’s breakdown this SPL query:
1. index=brute_force_lab (EventCode=4624 OR EventCode=4625)
- Search within my custom index (brute_force_lab)
- Filters for only login-related events:
- 4624: Successful Login
- 4625: Failed Login
2. | eval EventType=if(EventCode==4625, “Failed Login”, “Successful Login”)
- Adds a new field called EventType:
- It it’s 4625, label it ‘Failed Login”
- if it’s 4624, label it “Successful Login”
3. | timechart span=30s count by EventType
- This breaks time into 30-second windows
- Then it counts how many of each login type occurred in each window
2. Top Attacking IPs (Failed Logins Only)
The next panel was used to identify the most aggressive IP addresses based on the number of failed login attempts.
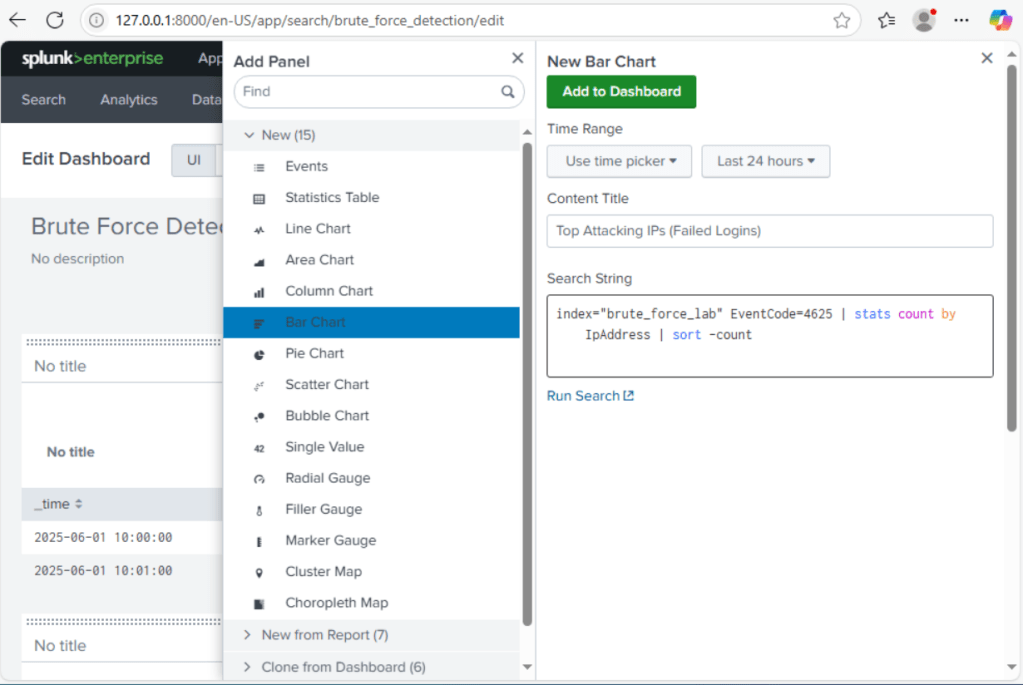
SPL Query Breakdown:
1. index=brute_force_lab EventCode=4625
- Searches custom index (brute_force_Lab)
- Filters only for Event ID 4625: Failed login attempts (Windows Security Log)
2. | stats count by IpAddress
- groups all failed login events by the IpAddress field
- Counts how many times each IP appears
3. | sort -count
- Sorts the results in descending order
- Puts the most aggressive IP addresses at the top.
This query gave me a ranked list of IPs that are triggering the most failed logins which could indicate potential brute force sources.
3. Brute Force Targets by Account
The next panel will highlight which user accounts are being targeted the most by failed logins.

SPL Query Breakdown:
1. index=brute_force_lab EventCode=4625
- Searches for all failed login attempts in custom index
- Focuses exclusively on Event ID 4625, which signals unsuccessful logon events.
2. | stats count by AccountName
- aggregates the data by the AccountName field
- counts how many failed attempts occurred for each user account
3. | where count > 5
- Filters the results to only show accounts with more than 5 failed login attempts
- This helps prioritize suspicious targets since repeat failures can indicate: Brute force attempts, Credential spraying, or targeted recon activity.
4. Successful Login Details
The last panel on my dashboard will audit successful logins which will help identify:
- A brute force attack that eventually worked
- Potentially compromised account
- a suspicious IP that failed 20 times, then succeeded
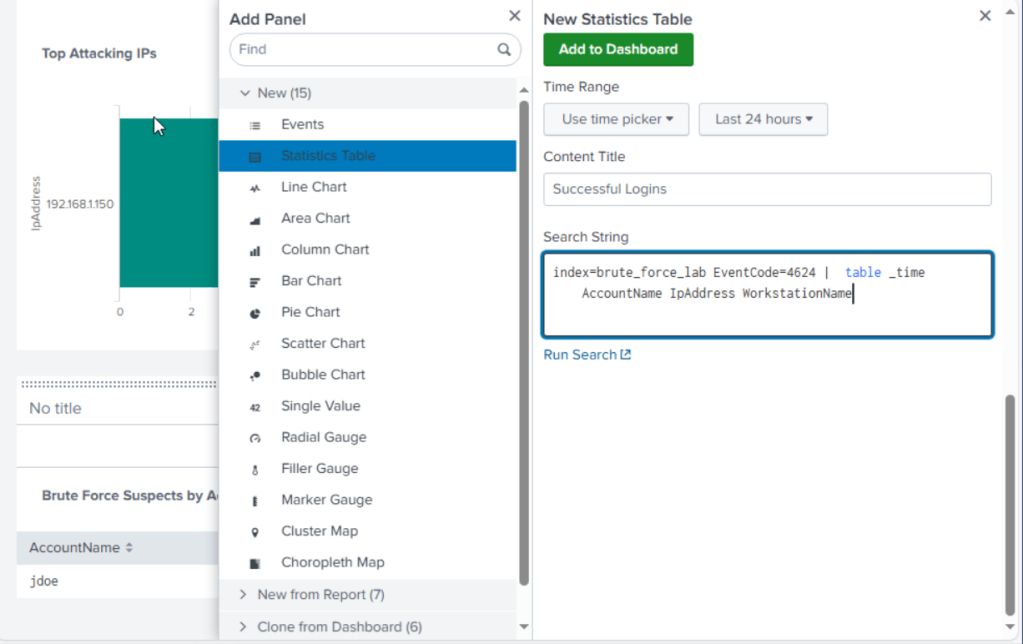
SPL Query Breakdown:
1. index=brute_force_lab EventCode=4624
- Searches for all successful login events only (Event ID 4624)
- These events can indicate normal activity or a compromise after brute force succeeded.
2. | table _time AccountName IpAddress WorkstationName
- this table comman formats the output to show specific fields:
- _time: When the login occurred
- Account Name: Who Logged in
- IpAddress: where the request came from
- WorkstationName: Which system was used
Created Alert logic
I implemented a simple Splunk alert to trigger if any IP address exceeds 10 failed login attempts in a short time frame, signaling a potential brute fore attack.

Lab Takeaways
- I leaned how interpret and parse structured event data using Splunk.
- Developed custom queries to highlight abnormal authentication behavior
- Built a dashboard to visualize logon trends and brute force patterns
- Practiced detection logic using Event IDs 4624 and 4625
- Strengthen skills in log correlation, report creation and alerting.


Leave a comment